Want more information? Browser our range of remote monitoring and control devices here:
Energy Monitoring Solution
The Wattmon Energy Monitoring Solution (EMS) cloud portal is an online platform to manage your assets in a highly-customizable graphical interface which enables you to access the logged data from all your Wattmon devices in a single place, regardless of whether the Internet connection on the Wattmon allows inbound access.
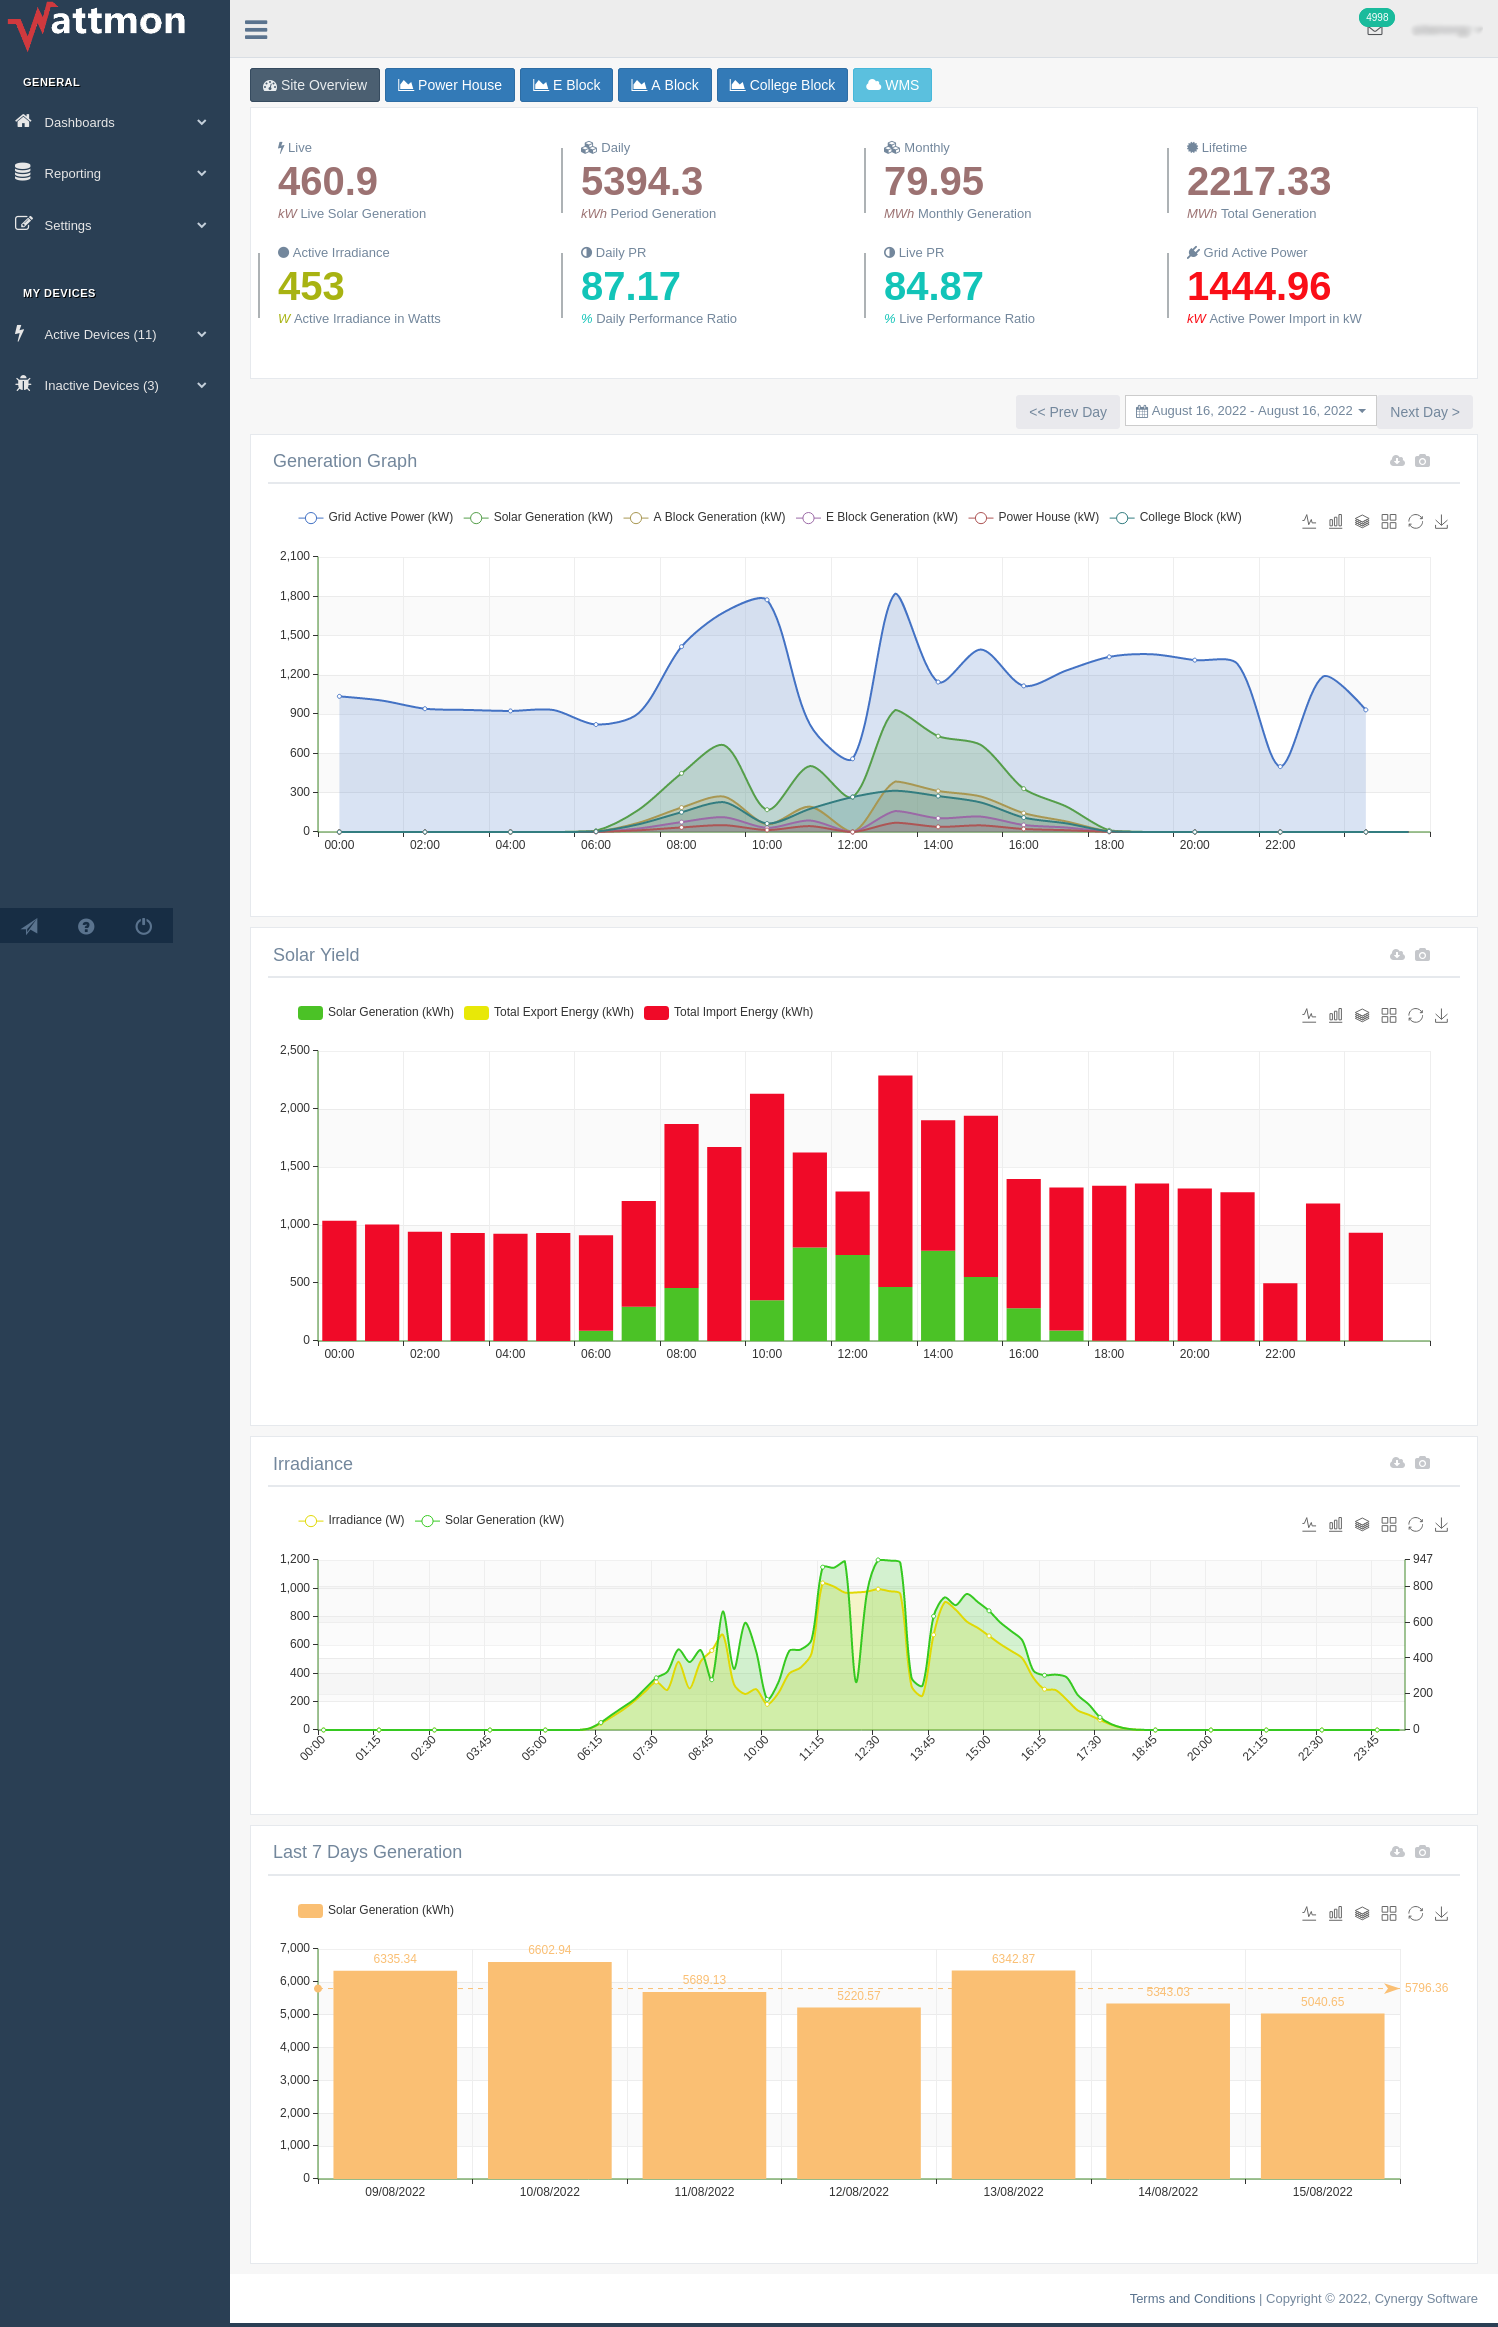
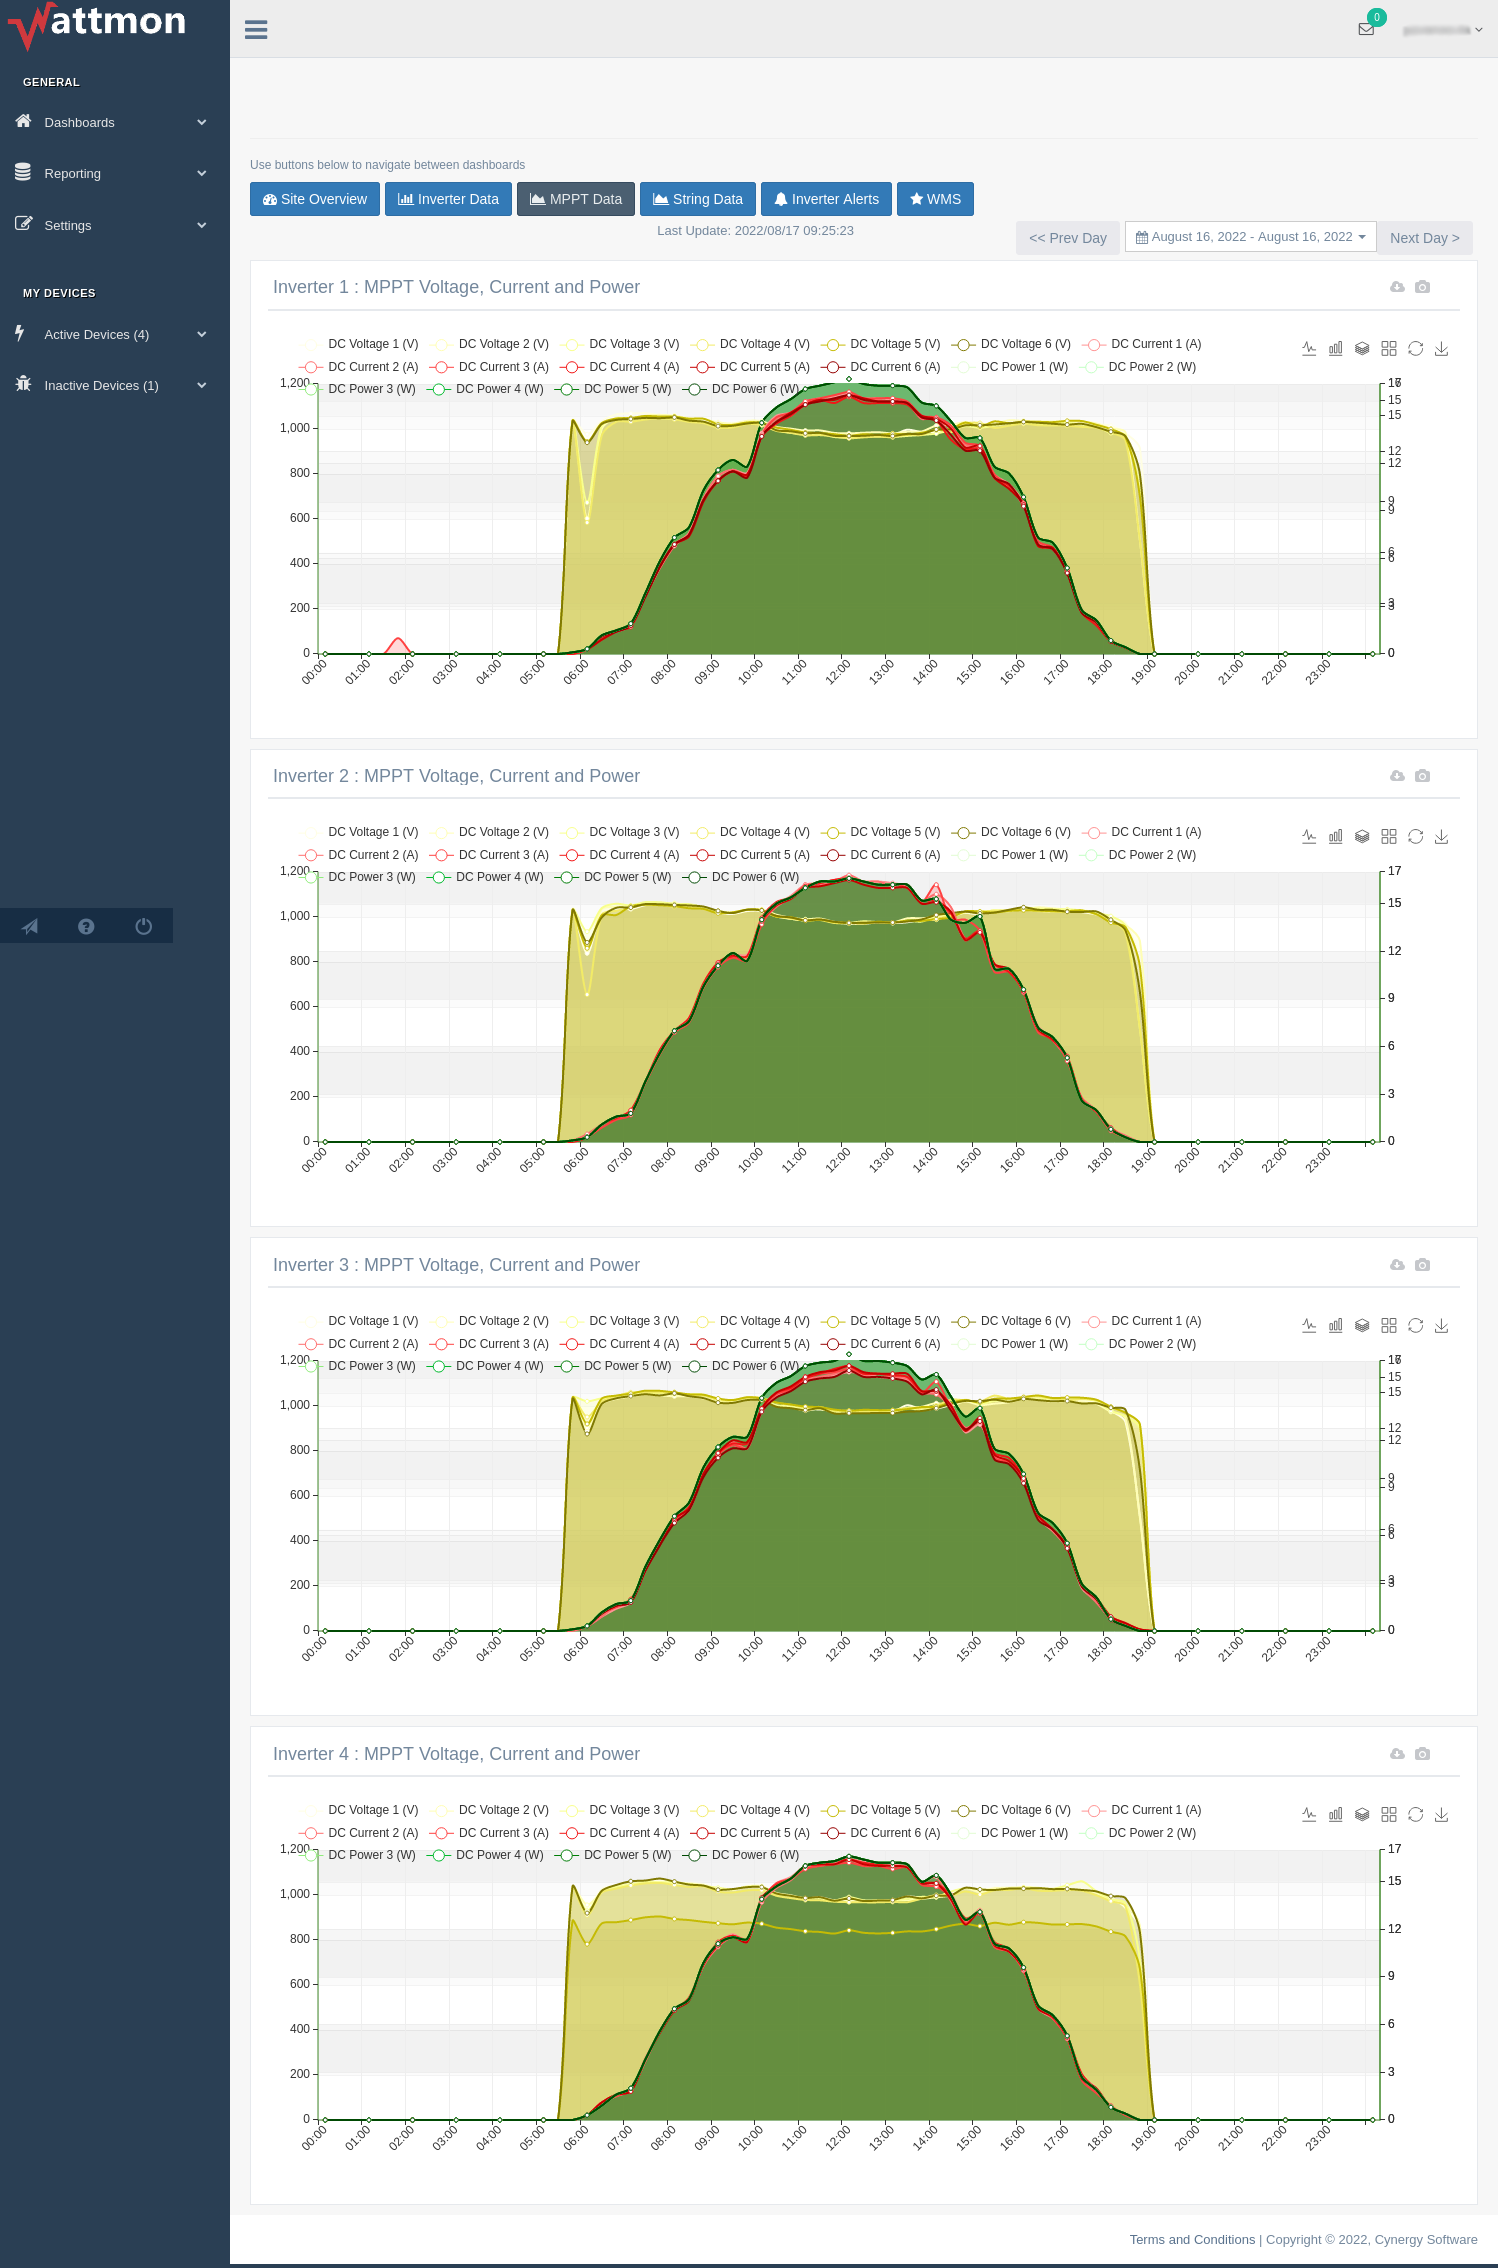
The EMS Portal allows you to preview real-time data from your energy assets through custom dashboards with interactive numerical and graphical widgets such as grid views and graph charts, in a responsive user interface, with provisions to display parameters dynamically for selective viewing of Inverter Curtailment Data, Performance Ratios, and Historic Comparisons. The same data may also be downloaded for further analysis by you.
Furthermore, oversee the Operations & Maintenance of your assets by sharing specific dashboards with multiple installers and end-users alike, providing different levels of user access and representation based on the user and the required level of data presentation.
The Wattmon EMS varies in annual charges based on the intended application; choose from our flexible pricing plans in Indian Rupees (₹). For USD based plans, please write to us. Each EMS plan supports a single Wattmon device only - you cannot link multiple Wattmon Data Loggers to a single subscription plan.
Flexible Pricing Plans
EMS 50
₹2000 /Year
- Suitable for Small Rooftop Projects
- Log up to Fifty (50) Data Points
- Data Logging Interval of One (1) Minute
- Download Single or Multiple Data Points in a .CSV / Spreadsheet-compatible Format
EMS 200
₹5000 /Year
- Suitable for 100+ Kilowatt Rooftop Projects
- Log up to Two Hundred (200) Data Points
- Create Multiple Combined & Customized Dashboards
- Data Logging Interval of One (1) Minute
- Support for Daily Generation Reports
- Download Single or Multiple Data Points in a .CSV / Spreadsheet-compatible Format
EMS 500
₹8000 /Year
- Suitable for Megawatt Scale Projects
- Log up to Five Hundred (500) Data Points
- Create Multiple Combined & Customized Dashboards
- Data Logging Interval of One (1) Minute
- Support for Daily Generation Reports
- Support for Email and/or WhatsApp-based Alerts
- Download Single or Multiple Data Points in a .CSV / Spreadsheet-compatible Format
EMS 1500
₹20000 /Year
- Suitable for Ground-Mounted Megawatt Scale Projects
- Log up to One-Thousand Five Hundred (1500) Data Points
- Create Multiple Combined & Customized Dashboards
- Data Logging Interval of One (1) Minute
- Support for Daily Generation Reports
- Support for Email and/or WhatsApp-based Alerts
- Download Single or Multiple Data Points in a .CSV / Spreadsheet-compatible Format
Dashboard Gallery
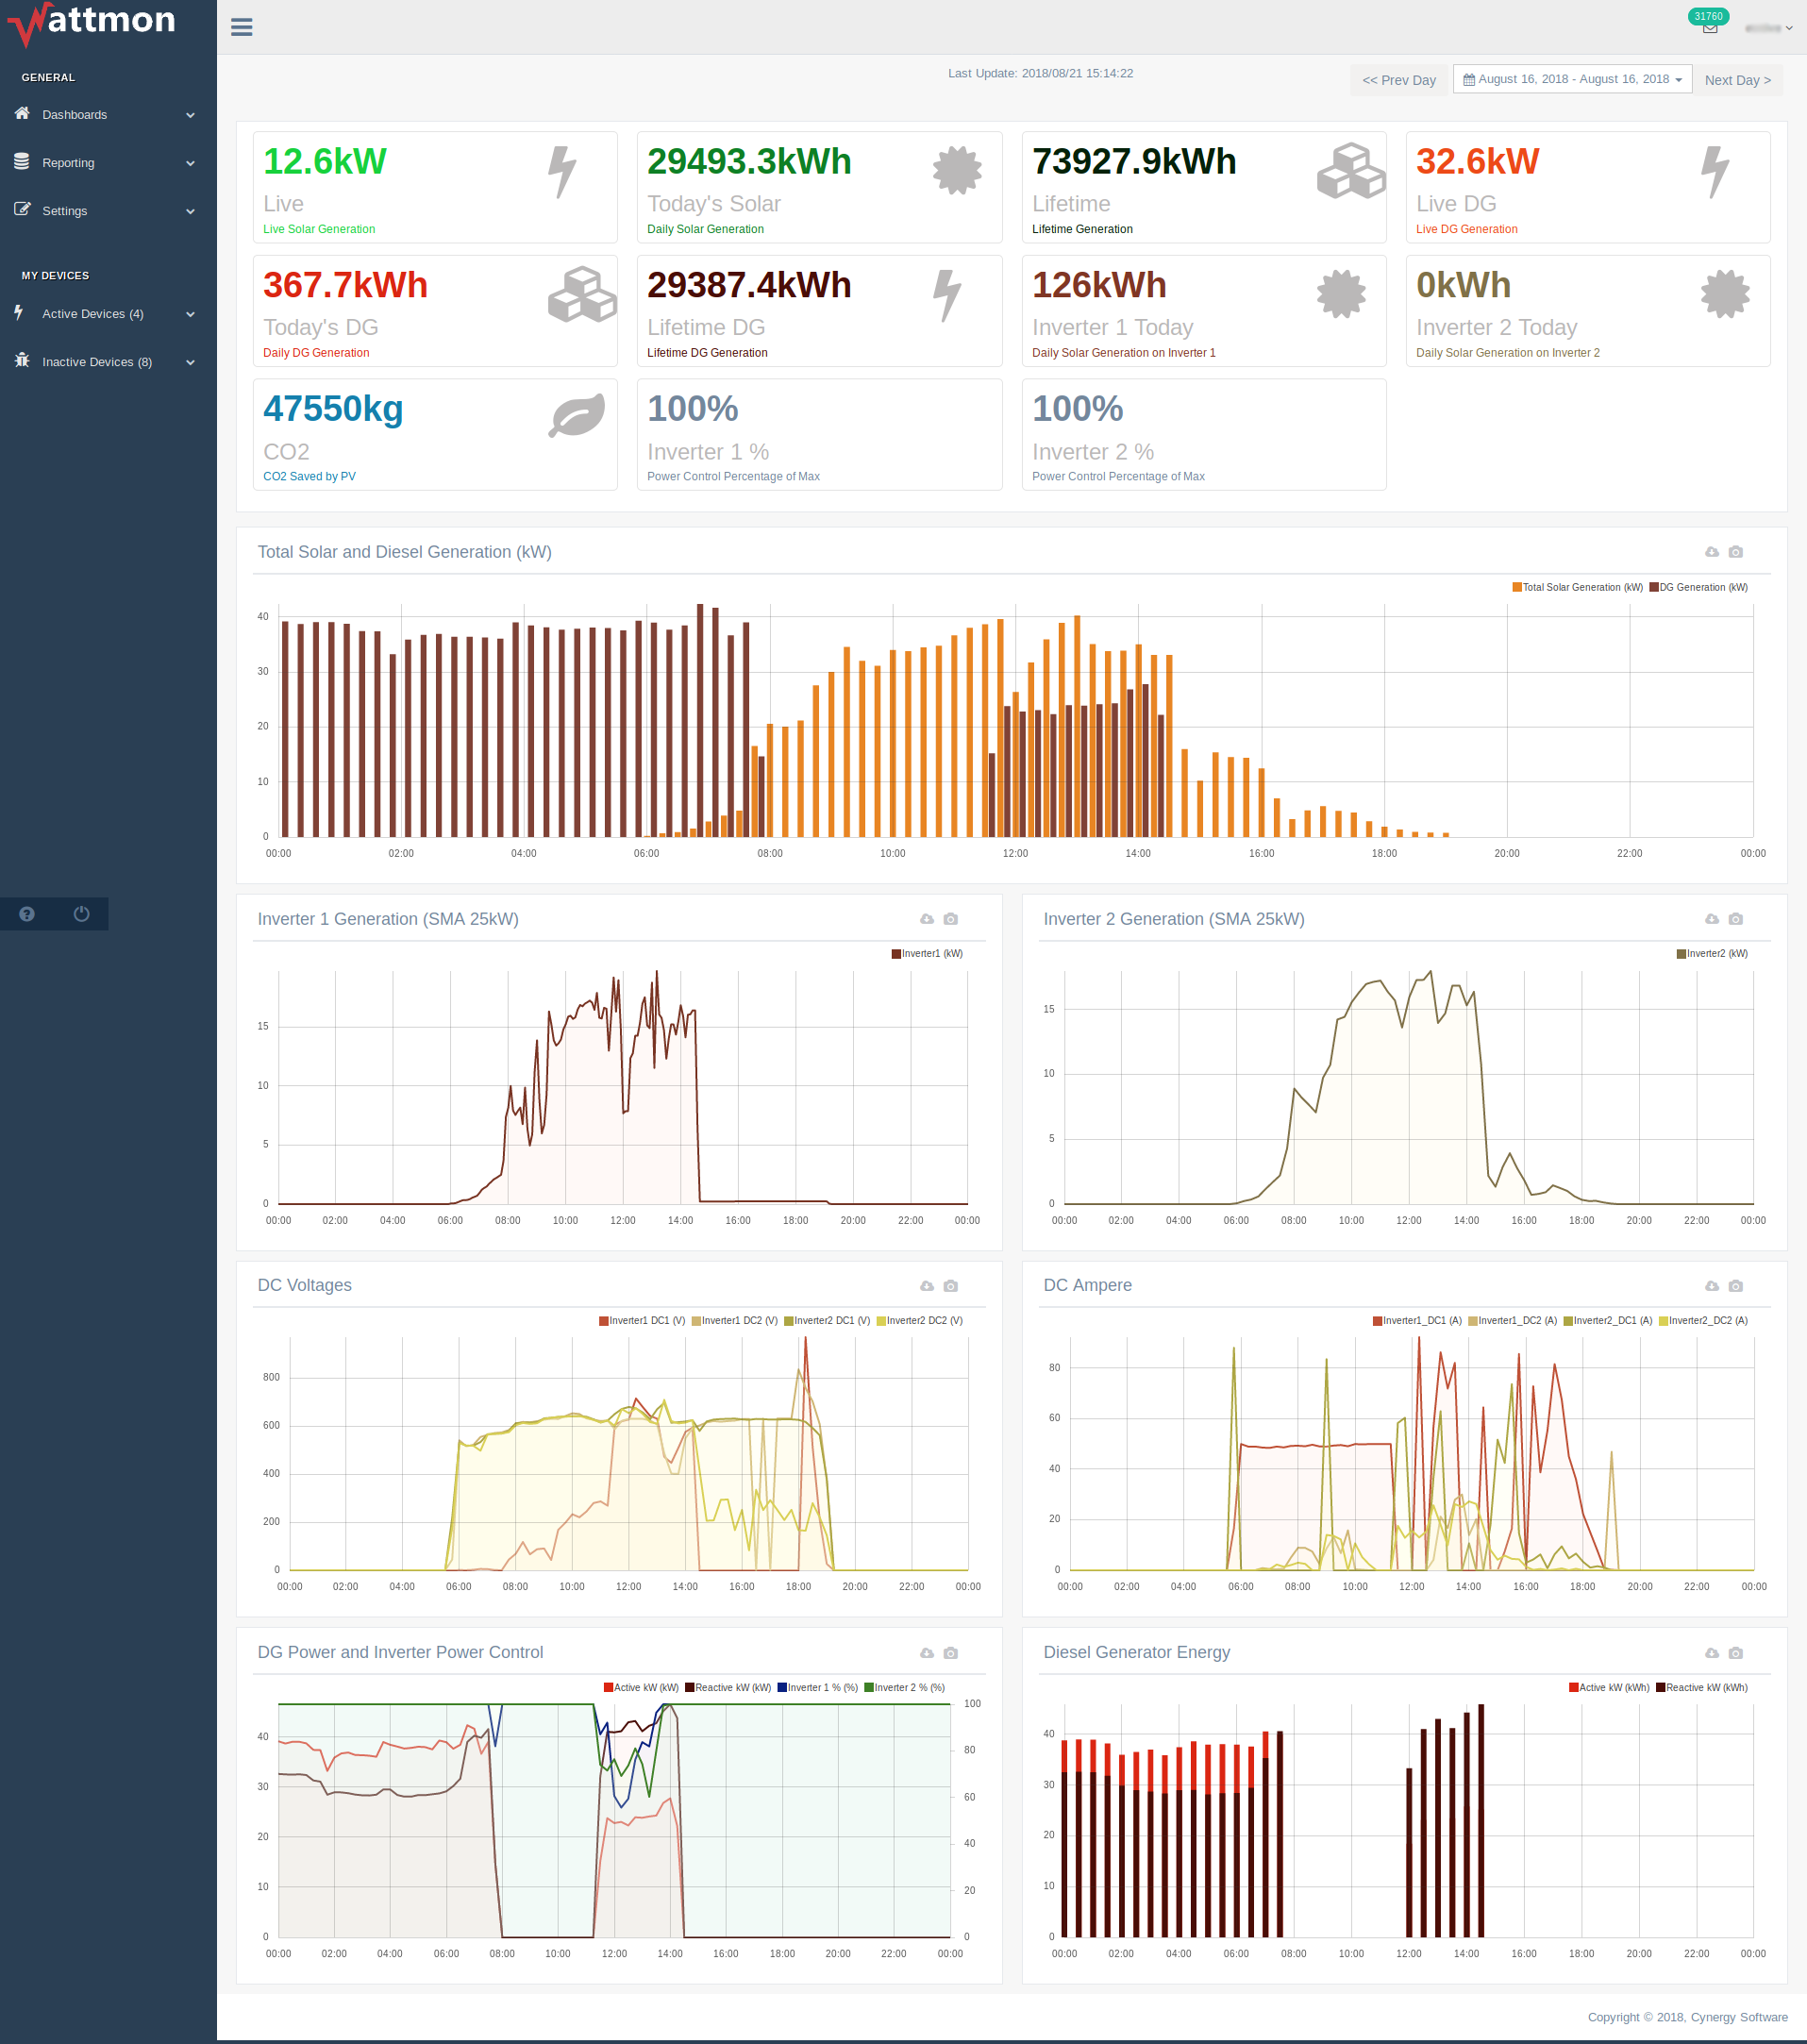
Dashboards can be completely customized with a variety of widgets that can be positioned as desired. Special formulas can be applied to each value to calculate the displayed result using historic data, live data or a combination of values from various data points.
Seen below are some of the customized dashboards created and used by our customers.
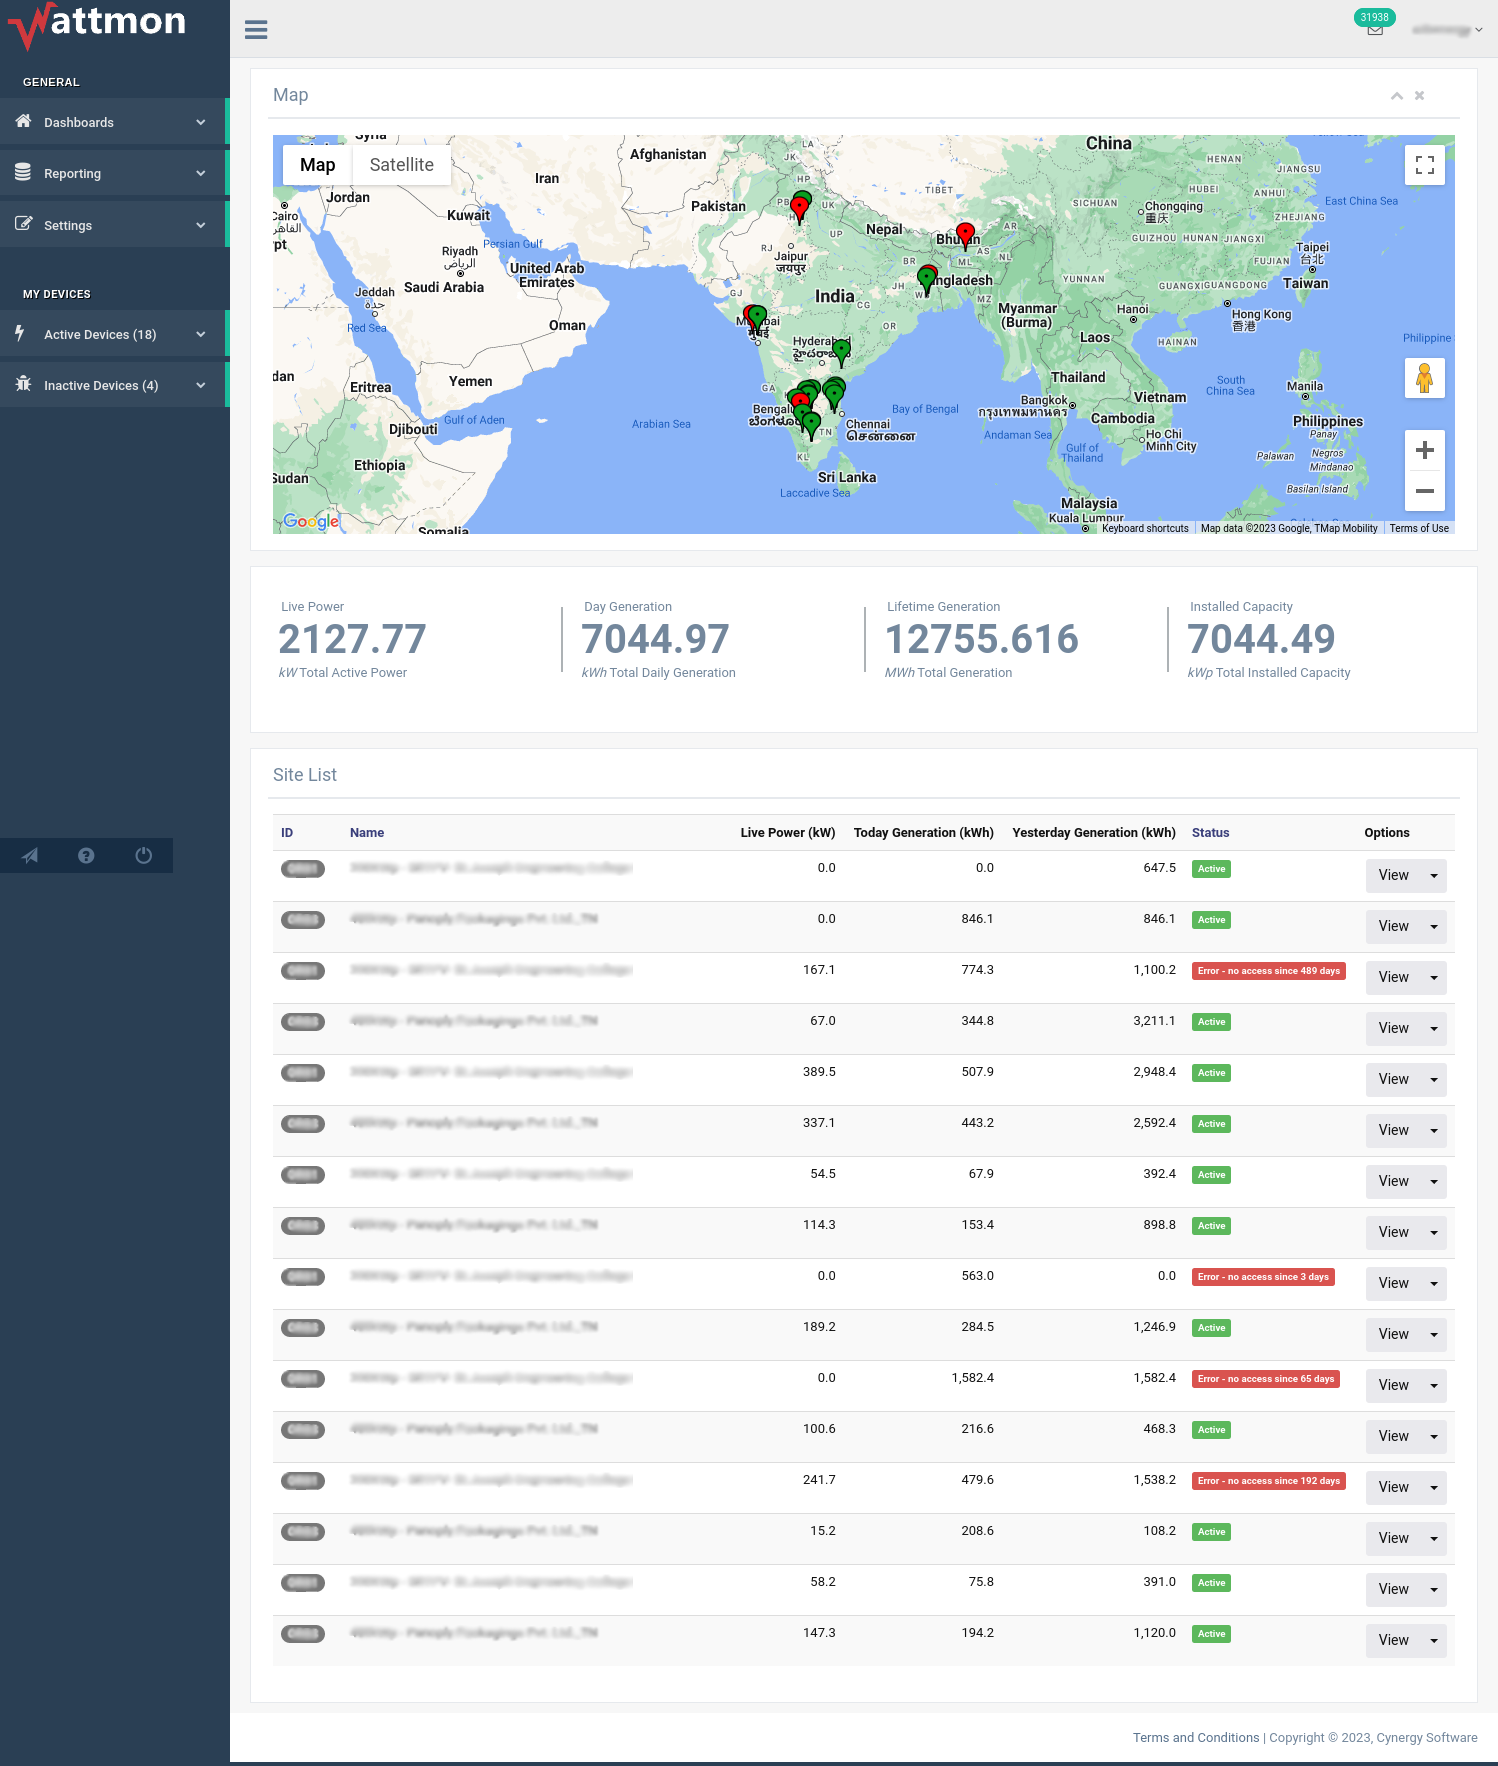
Main Dashboard
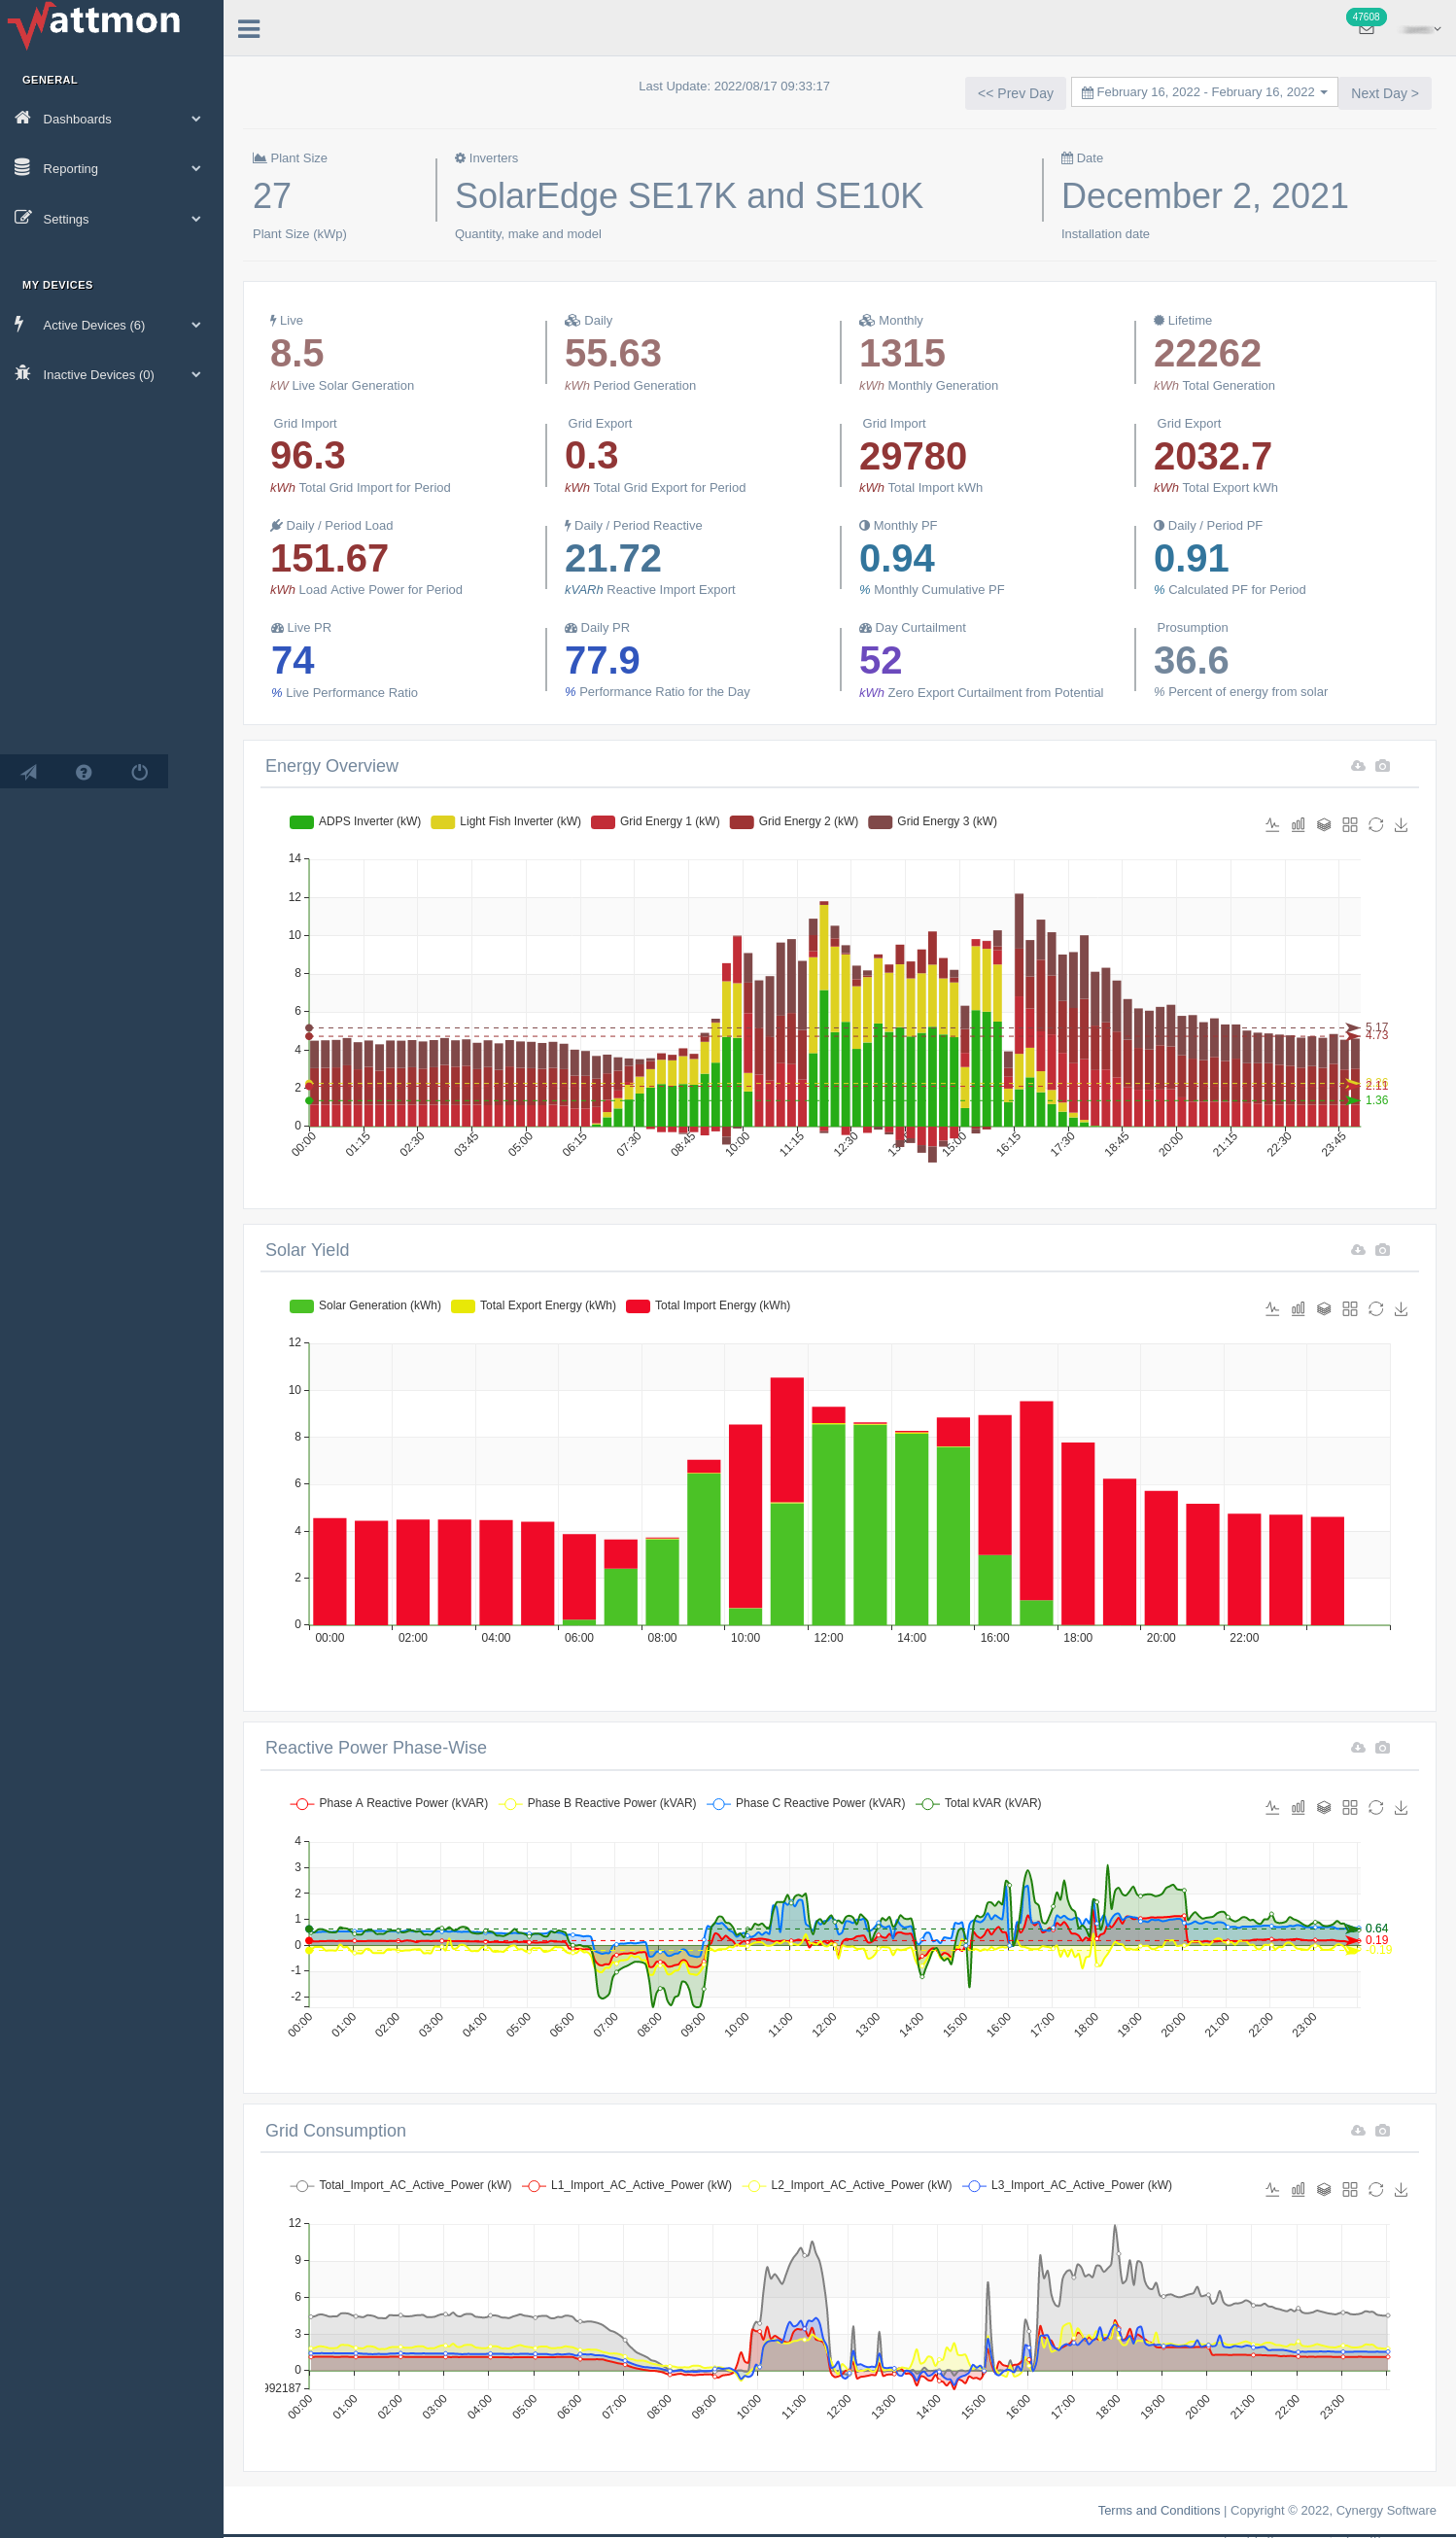
Comparative Generation
Generation vs. Curtailment
Combined Device Dashboard
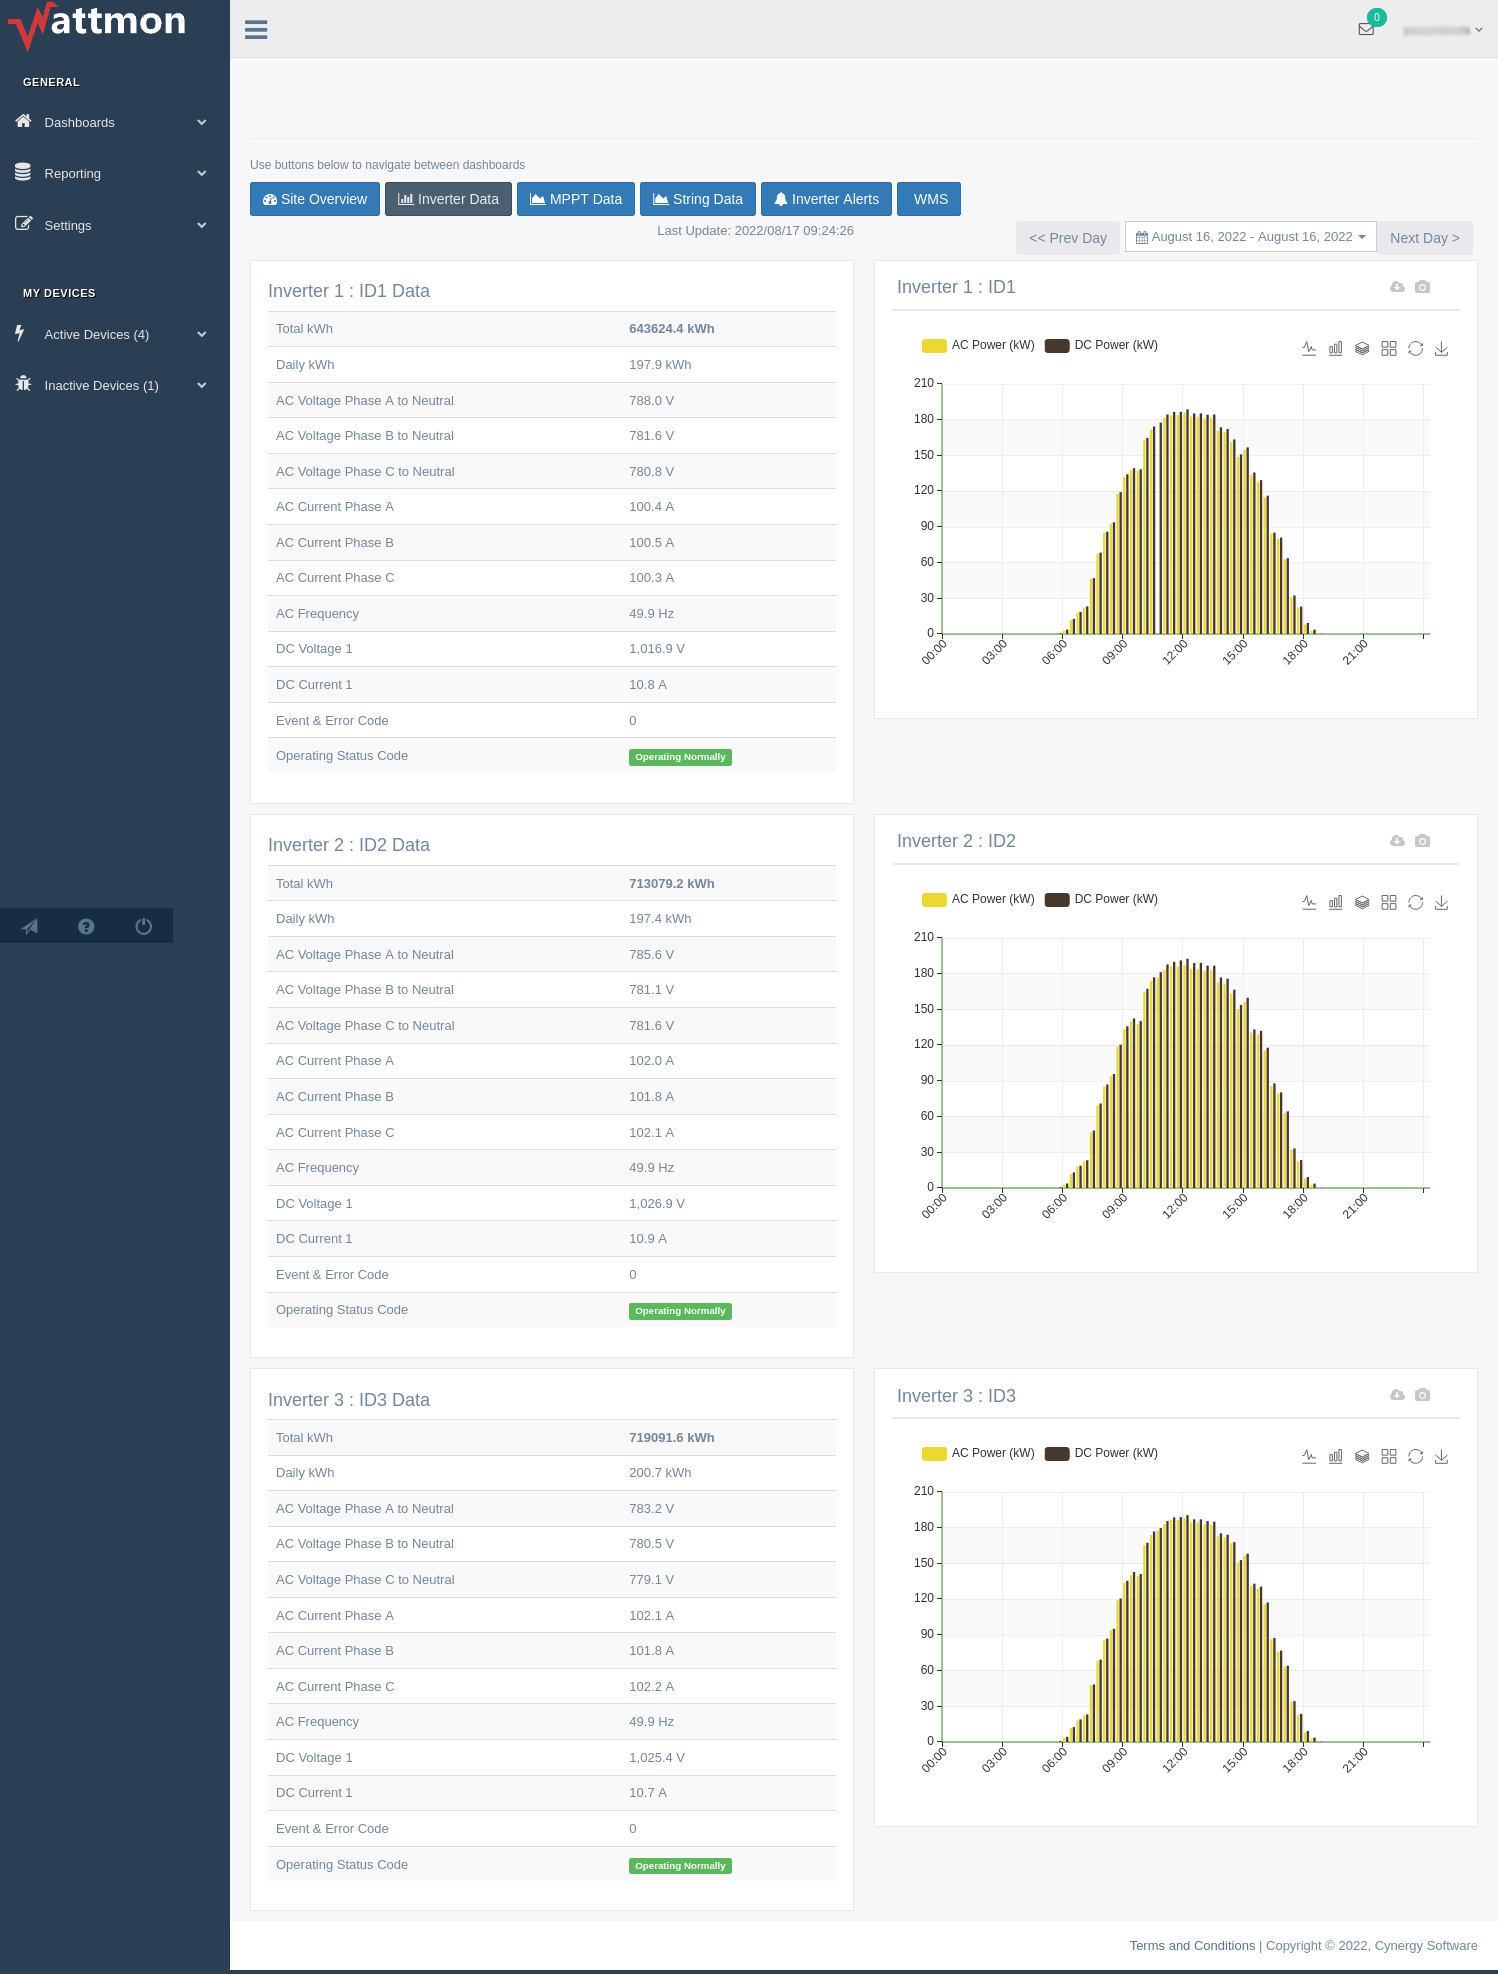
Inverter Data
String-Level Data